The Resume
The Resume
The Resume
SNAPSHOT: MORGAN STANLEY
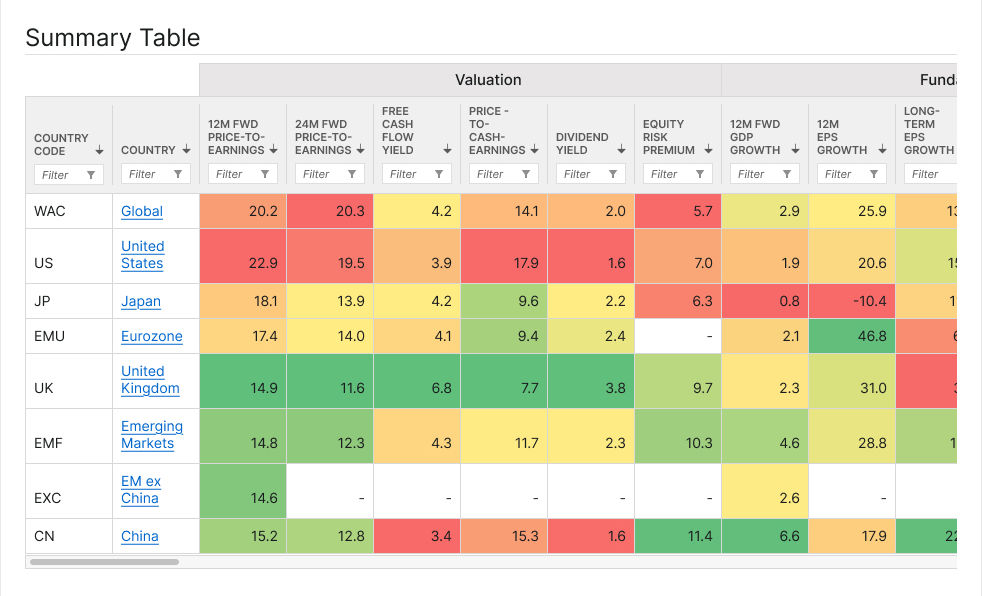
Financial Data Heatmap
Designed an enterprise data visualization system that transformed complex financial data into a more scannable and actionable experience.
ROLE
Lead Product Designer • 2020-21
SKILLS DEMONSTRATED
Data Visualization
Enterprise UX
Accessibility
Design Systems
Cross-Functional Collaboration
CHALLENGE
Financial teams needed a way to quickly identify patterns and performance trends within large datasets. Traditional tables made it difficult to recognize meaningful changes at a glance, while heatmaps introduced challenges around color usage, accessibility, and implementation complexity.
OUTCOME
Delivered an enterprise-ready heatmap visualization that improved data scanability while balancing usability, accessibility, and technical feasibility.
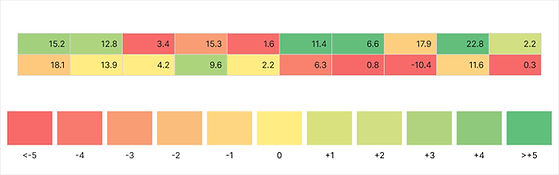
Visual Hierarchy & Thresholds
Created a structured heatmap framework that translated raw data into meaningful visual patterns without overwhelming users.
Accessibility Considerations
Balanced color usage, contrast, and readability to support users with varying visual abilities while maintaining data clarity.
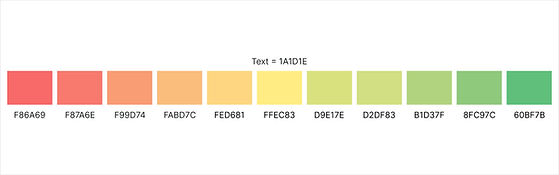
Design & Development Alignment
Collaborated with engineering teams to ensure visual rules, thresholds, and interaction behaviors could be consistently implemented.

KEY TAKEAWAYS
Reorganized financial information into a visual heatmap that allowed advisors to quickly identify trends, outliers, and areas requiring attention without manually comparing rows of data.
Applied hierarchy, color, and spacing to surface the most important information first, allowing users to scan large datasets more efficiently and confidently.
Designed an interface that helped financial professionals move beyond simply viewing data to identifying patterns and making faster, more informed decisions.