The Resume
The Resume
The Resume
SNAPSHOT: MORGAN STANLEY
Performance Analytics
Dashboard
Designed a scalable reporting experience that helped users analyze, organize, and present complex financial performance data across large datasets.
ROLE
Lead Product Designer • 2020-21

SKILLS DEMONSTRATED
Enterprise UX
Dashboard Design
Information Architecture
Workflow Design
Data Visualization
CHALLENGE
Users needed to analyze complex performance data across large reporting tables while maintaining flexibility for searching, sorting, exporting, and presentation workflows. As reporting requirements expanded, the existing information structure struggled to scale.
OUTCOME
Created a scalable reporting framework that improved the organization of complex datasets while establishing patterns for future dashboard growth.
Information Architecture
Reorganized large reporting tables using parent-child column relationships, reducing visual clutter while improving scanability. By restructuring long column labels into a hierarchical system, users could quickly understand the data without excessive truncation or loss of context.
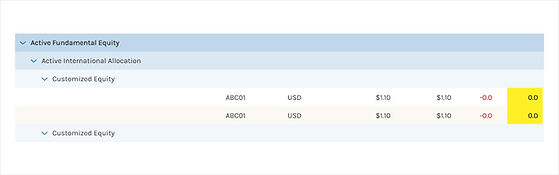
Search & Sorting Workflows
Designed search and sorting patterns that helped users navigate large datasets while maintaining visibility of critical performance information. The experience balanced flexibility with clarity, ensuring users could locate and compare data efficiently.

Scalable Dashboard Foundation
Established structural patterns that could support future reporting tools and dashboard experiences across the platform. The work laid the foundation for a broader reporting ecosystem while solving immediate workflow challenges.
KEY TAKEAWAYS
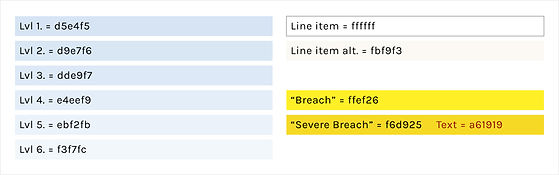
Reorganized reporting data into a clear visual hierarchy, enabling investment professionals to identify trends and key performance indicators more quickly.
Reduced cognitive load through better grouping, spacing, and information architecture, making complex reports easier to review at a glance.
Transformed dense reporting data into a streamlined dashboard experience that supported quicker analysis and more informed investment decisions.